Setting Up GitHub Actions CI/CD with AWS: A Practical Journey

Introduction: Why This Matters
Picture this: it’s Friday afternoon, and your team needs to deploy a critical bug fix. In the old days, this meant manually building the application, running tests locally, uploading files to servers, and crossing your fingers that nothing breaks. Today, we’ll learn how to automate this entire process using GitHub Actions and AWS, turning what used to be a nerve-wracking manual process into a reliable, automated pipeline.
The Real Cost of Manual Deployments: According to the 2021 State of DevOps Report, organizations with mature CI/CD practices deploy 208 times more frequently and have 106 times faster lead times than low performers. More importantly, they have 7 times lower change failure rates and recover from incidents 2,604 times faster.
This guide will take you through my journey of setting up a production-ready CI/CD pipeline for a Node.js application. We’ll start from scratch and build up to a fully automated deployment system. By the end, you’ll understand not just the “how” but also the “why” behind each decision.
Learning Path: If you’re new to DevOps concepts, I recommend starting with the DevOps Handbook for foundational principles, then diving into practical implementation with this guide.
Understanding CI/CD: The Foundation
Before diving into our implementation, let’s establish what CI/CD actually means and why these practices are essential for modern software development.
Continuous Integration (CI) is the practice of automatically integrating code changes from multiple contributors into a shared repository. Every time someone pushes code, automated processes run to verify that the new code doesn’t break existing functionality. Think of it as having a diligent assistant who checks every piece of work before it gets added to the main project.
Why CI Matters: Without CI, integration becomes a painful, risky process. Teams working on separate features for weeks find themselves in “integration hell” when trying to merge their changes. CI prevents this by catching integration issues early when they’re easier and cheaper to fix.
Continuous Deployment (CD) takes this a step further by automatically deploying code that passes all tests to production. It’s like having that same assistant not only check the work but also publish it live when everything looks good.
Why CD Matters: Manual deployments are error-prone, slow, and create bottlenecks. As Jez Humble explains in Continuous Delivery, “The key insight is that the deployment pipeline should be the only way to deploy to production.” This ensures consistency and reduces the risk of human error.
The magic happens when these two concepts work together. CI ensures code quality, while CD ensures rapid, reliable delivery to users. For a deeper dive into CI/CD concepts, Martin Fowler’s article on Continuous Integration provides excellent foundational knowledge.
The Business Impact: Organizations practicing CI/CD see:
- Faster Time to Market: Features reach users weeks or months sooner
- Higher Quality: Automated testing catches bugs before they reach production
- Reduced Risk: Smaller, frequent changes are easier to test and rollback
- Developer Satisfaction: Less time fighting deployments means more time building features
Essential Reading: For comprehensive coverage of these concepts, I highly recommend Accelerate by Nicole Forsgren, Jez Humble, and Gene Kim, which provides research-backed evidence for DevOps practices.
Our Story: The Application We’re Building
Let me share the context of our project and why we chose this particular architecture. We were building a REST API for a task management system using Node.js and Express. The application needed to:
- Handle user authentication
- Manage CRUD operations for tasks
- Store data in a PostgreSQL database
- Serve thousands of requests per day
Why Node.js? We chose Node.js for several reasons:
- Rapid Development: Excellent ecosystem and fast iteration cycles
- Team Expertise: Our team was already proficient in JavaScript
- Async Performance: Well-suited for I/O-heavy API operations
- Docker-Friendly: Lightweight containers and fast startup times
Initially, our deployment process was entirely manual. We would SSH into our EC2 instance, pull the latest code, install dependencies, run tests, and restart the server. This process took about 30 minutes and was prone to human error.
The Pain Points We Experienced:
- Inconsistent Environments: “It works on my machine” syndrome
- Deployment Anxiety: Every deployment was stressful and risky
- Lost Productivity: Developers spent hours on deployment tasks instead of building features
- Recovery Time: When deployments failed, it took hours to diagnose and fix issues
We knew there had to be a better way. The solution was implementing CI/CD practices that teams at companies like Netflix and Etsy had been using successfully for years.
Chapter 1: Setting Up GitHub Actions
GitHub Actions is GitHub’s native CI/CD solution. It allows you to automate workflows directly from your repository. Why choose GitHub Actions over alternatives like Jenkins or CircleCI?
Advantages of GitHub Actions:
- Native Integration: No external services to manage
- Rich Ecosystem: Thousands of pre-built actions in the marketplace
- Free Tier: 2,000 minutes per month for public repositories
- Security: Built-in secret management and permissions
- Ease of Use: YAML configuration right in your repository
Understanding GitHub Actions Architecture
Why This Architecture? GitHub Actions works on a simple principle that mirrors real-world workflows: Events trigger Workflows, which contain Jobs, which contain Steps. This hierarchical structure provides flexibility while maintaining clarity.
Let me break this down with real-world analogies:
- Events: Things that happen in your repository (push, pull request, issue creation) - like receiving a new order in a restaurant
- Workflows: Automated processes defined in YAML files - like the complete process of preparing and serving a meal
- Jobs: Units of work that run on virtual machines - like individual cooking stations (prep, grill, dessert)
- Steps: Individual tasks within a job - like specific actions (chop vegetables, season meat, plate dish)
Why YAML? YAML was chosen for GitHub Actions configuration because:
- Human Readable: Easy to understand and review in pull requests
- Version Controlled: Changes to pipelines are tracked just like code changes
- Widely Adopted: Used by Kubernetes, Docker Compose, and other DevOps tools
Deep Dive: For comprehensive GitHub Actions documentation, see the official guide. The GitHub Actions Marketplace contains thousands of pre-built actions to accelerate your workflows.
Creating Your First Workflow
Why Start Simple? As the Google SRE Book teaches us, “Hope is not a strategy.” We start with a simple workflow to establish confidence before adding complexity.
In your repository, create a directory structure:
.github/
└── workflows/
    └── ci.yml
Why This Directory Structure? GitHub automatically discovers workflows in .github/workflows/, making it a convention that improves discoverability and consistency across projects.
Here’s our initial CI workflow:
name: Continuous Integration

# This workflow triggers on two events:
# 1. When code is pushed to main branch
# 2. When a pull request targets main branch
# Why these triggers? They catch issues early in the development process
on:
  push:
    branches: [ main ]
  pull_request:
    branches: [ main ]

jobs:
  test:
    # Why ubuntu-latest? It's free, fast, and has excellent tool support
    # Alternatives: windows-latest, macos-latest (but cost more)
    runs-on: ubuntu-latest

    # Node.js versions to test against
    # Why matrix testing? Ensures compatibility across versions your users might have
    strategy:
      matrix:
        node-version: [16.x, 18.x, 20.x]

    steps:
    # Check out the repository code
    # Why v3? It's the latest stable version with security improvements
    - uses: actions/checkout@v3

    # Set up Node.js environment
    - name: Use Node.js $
      uses: actions/setup-node@v3
      with:
        node-version: $

    # Cache dependencies for faster builds
    # Why cache? npm install can take 30-60 seconds; caching reduces this to 5-10 seconds
    - name: Cache dependencies
      uses: actions/cache@v3
      with:
        path: ~/.npm
        # Why hash the lock file? Cache is invalidated only when dependencies change
        key: $-node-$
        restore-keys: |
          $-node-

    # Install project dependencies
    # Why npm ci instead of npm install? It's faster and more reliable for CI environments
    - name: Install dependencies
      run: npm ci

    # Run linting to check code style
    # Why lint first? Code style issues are faster to check than running full test suite
    - name: Run linter
      run: npm run lint

    # Run unit tests
    # Why after linting? No point running tests if code doesn't meet style standards
    - name: Run tests
      run: npm test

    # Generate test coverage report
    # Why coverage? Helps identify untested code and technical debt
    - name: Generate coverage report
      run: npm run test:coverage
Why This Order of Steps? The workflow follows the “fail fast” principle:
- Setup (fastest) - Get environment ready
- Linting (fast) - Check code style before running expensive tests
- Tests (slow) - Verify functionality
- Coverage (slowest) - Generate detailed reports
This workflow does several important things:
- Matrix Testing: Tests your code against multiple Node.js versions simultaneously, ensuring compatibility
- Dependency Caching: Speeds up builds by caching npm packages between runs
- Comprehensive Checks: Runs linting and tests to ensure code quality
Performance Impact: Without caching, each workflow run might take 3-5 minutes. With caching, this drops to 1-2 minutes. Over hundreds of runs per month, this saves hours of developer waiting time.
Understanding the Service Container Pattern
Why Service Containers? Our application depends on PostgreSQL for testing. We could mock the database, but that creates a gap between test and production environments. Service containers provide real database instances for testing.
The Problem with Mocking: As Martin Fowler discusses in his article on Test Doubles, mocks can hide integration issues. Service containers give us confidence that our code works with real dependencies.
GitHub Actions provides an elegant solution through service containers:
jobs:
  test:
    runs-on: ubuntu-latest

    # Service containers run alongside your job
    # Why alongside? They share the same network, making connection simple
    services:
      postgres:
        image: postgres:14  # Why version 14? It's stable, widely supported, and matches our production
        env:
          POSTGRES_USER: testuser
          POSTGRES_PASSWORD: testpass
          POSTGRES_DB: testdb
        # Health checks ensure the database is ready
        # Why health checks? Database startup can take 10-30 seconds
        options: >-
          --health-cmd pg_isready
          --health-interval 10s
          --health-timeout 5s
          --health-retries 5
        ports:
          # Why port mapping? Makes the service accessible to our test jobs
          - 5432:5432

    steps:
    - uses: actions/checkout@v3

    - name: Use Node.js
      uses: actions/setup-node@v3
      with:
        node-version: '18.x'

    - name: Install dependencies
      run: npm ci

    - name: Run tests with database
      env:
        # These environment variables are used by our app
        # Why environment variables? They keep secrets out of code and enable different configs per environment
        DATABASE_URL: postgresql://testuser:testpass@localhost:5432/testdb
        NODE_ENV: test
      run: npm test
Why This Pattern Works:
- Isolation: Each workflow run gets a fresh database
- Speed: No external dependencies or complex setup
- Reliability: Tests aren’t affected by external service outages
- Realistic: Tests run against the same database engine as production
The service container pattern is powerful because it mirrors production architecture in your test environment. Your tests run against a real PostgreSQL instance, catching database-related issues early.
Best Practice: For more complex database testing patterns, see Database Testing Best Practices by Martin Fowler.
Chapter 2: Preparing for AWS Deployment
Now that we have CI working, let’s set up continuous deployment to AWS. Why AWS? While there are many cloud providers, AWS offers:
- Mature Ecosystem: Comprehensive services for every use case
- Integration: Excellent GitHub Actions support
- Documentation: Extensive tutorials and community resources
- Flexibility: From simple EC2 instances to sophisticated container orchestration
We’ll deploy to an EC2 instance running Ubuntu, though the concepts apply to other AWS services like ECS or Elastic Beanstalk.
Why Start with EC2? While services like Elastic Beanstalk or ECS are more sophisticated, EC2 helps you understand the fundamentals. As the AWS Well-Architected Framework states, “Understand what you implement.”
Understanding AWS Credentials and Security
Why Security Matters: A compromised CI/CD pipeline can be catastrophic. As the OWASP Top 10 consistently shows, security vulnerabilities often come from mishandled credentials and insufficient access controls.
Security is paramount when dealing with cloud deployments. We need to give GitHub Actions permission to deploy to AWS without exposing sensitive credentials. Here’s how we approach this:
The Principle of Least Privilege: Each component should have only the minimum permissions necessary to function. This limits the blast radius if credentials are compromised.
- Create an IAM User: This user will have minimal permissions needed for deployment
- Generate Access Keys: These will be stored as GitHub secrets
- Configure GitHub Secrets: Encrypted variables that workflows can access
Why IAM Users Instead of Root? AWS root accounts have unlimited access. IAM users can be restricted to specific permissions, reducing security risk.
Let’s create an IAM policy for our deployment user:
{
  "Version": "2012-10-17",
  "Statement": [
    {
      "Sid": "EC2InstanceConnect",
      "Effect": "Allow",
      "Action": [
        "ec2:DescribeInstances",
        "ec2-instance-connect:SendSSHPublicKey"
      ],
      "Resource": "*"
    },
    {
      "Sid": "S3DeploymentBucket",
      "Effect": "Allow",
      "Action": [
        "s3:PutObject",
        "s3:GetObject",
        "s3:ListBucket"
      ],
      "Resource": [
        "arn:aws:s3:::your-deployment-bucket/*",
        "arn:aws:s3:::your-deployment-bucket"
      ]
    }
  ]
}
Why These Specific Permissions?
- EC2 Instance Connect: Enables secure SSH without permanent key files
- S3 Access: Allows storing deployment artifacts for rollbacks and auditing
- Describe Instances: Enables dynamic discovery of deployment targets
This policy follows the principle of least privilege—it only allows what’s necessary for deployment.
Security Deep Dive: For comprehensive AWS security best practices, see the AWS Security Best Practices documentation and the AWS IAM Best Practices Guide.
Setting Up GitHub Secrets
Why GitHub Secrets? They provide encrypted storage for sensitive data that workflows need. GitHub encrypts secrets using libsodium sealed boxes.
In your repository settings, add these secrets:
AWS_ACCESS_KEY_ID: Your IAM user’s access keyAWS_SECRET_ACCESS_KEY: Your IAM user’s secret keyAWS_REGION: Your AWS region (e.g., us-east-1)EC2_HOST: Your EC2 instance’s public IP or domainEC2_USER: The SSH user (usuallyubuntuorec2-user)EC2_SSH_KEY: Your EC2 instance’s private SSH key
Security Best Practices for Secrets:
- Rotate Regularly: Change access keys every 90 days
- Use Specific Names: Clear naming prevents accidental misuse
- Audit Access: Monitor when secrets are accessed
- Environment Separation: Use different secrets for staging and production
Chapter 3: Building the Deployment Pipeline
Now comes the exciting part—creating the deployment workflow. Why separate workflows? While you could combine CI and CD in one workflow, separation provides:
- Flexibility: Run tests on pull requests without deploying
- Security: Different permission levels for different stages
- Reliability: Deployment failures don’t affect CI feedback
- Clarity: Easier to understand and maintain
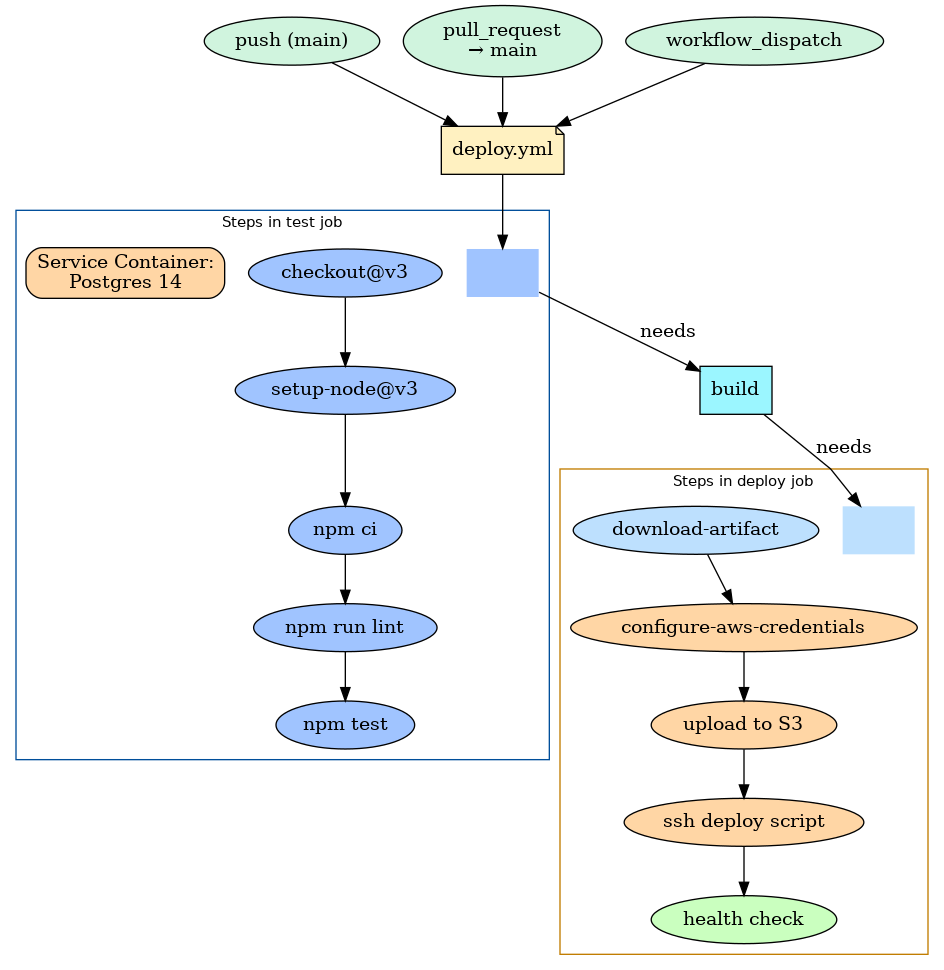
This workflow will build our application, run tests, and deploy to AWS if everything passes.
name: Deploy to AWS

# Why only on main branch pushes? We want to deploy only tested, approved code
on:
  push:
    branches: [ main ]

jobs:
  test:
    runs-on: ubuntu-latest
    steps:
    - uses: actions/checkout@v3

    - name: Use Node.js
      uses: actions/setup-node@v3
      with:
        node-version: '18.x'

    - name: Install dependencies
      run: npm ci

    - name: Run tests
      run: npm test

    # Only proceed to build job if tests pass
    # This creates a gate in our pipeline

  build:
    needs: test  # This job depends on 'test' job success
    runs-on: ubuntu-latest
    steps:
    - uses: actions/checkout@v3

    - name: Use Node.js
      uses: actions/setup-node@v3
      with:
        node-version: '18.x'

    - name: Install production dependencies
      # Why --only=production? Smaller package, faster deploys, fewer security vulnerabilities
      run: npm ci --only=production

    - name: Build application
      run: npm run build

    # Create deployment artifact
    - name: Create deployment package
      run: |
        # Remove development files
        rm -rf .git .github test coverage docs

        # Create timestamp for versioning
        echo "DEPLOY_VERSION=$(date +%Y%m%d%H%M%S)" >> $GITHUB_ENV

        # Package application
        tar -czf deploy-$.tar.gz .

    # Upload artifact for deployment job
    # Why separate build and deploy jobs? Enables different runners, security boundaries
    - name: Upload deployment artifact
      uses: actions/upload-artifact@v3
      with:
        name: deploy-package
        path: deploy-*.tar.gz
        retention-days: 7

  deploy:
    needs: build
    runs-on: ubuntu-latest
    # Only deploy from main branch
    if: github.ref == 'refs/heads/main'

    steps:
    - name: Download deployment artifact
      uses: actions/download-artifact@v3
      with:
        name: deploy-package

    # Configure AWS credentials
    - name: Configure AWS credentials
      uses: aws-actions/configure-aws-credentials@v2
      with:
        aws-access-key-id: $
        aws-secret-access-key: $
        aws-region: $

    # Upload to S3 first (backup and staging)
    # Why S3 first? Creates a backup, enables multi-server deployments, provides audit trail
    - name: Upload to S3
      run: |
        DEPLOY_FILE=$(ls deploy-*.tar.gz)
        aws s3 cp $DEPLOY_FILE s3://your-deployment-bucket/releases/
        echo "DEPLOY_FILE=$DEPLOY_FILE" >> $GITHUB_ENV

    # Deploy to EC2
    - name: Deploy to EC2
      env:
        PRIVATE_KEY: $
      run: |
        # Save private key
        echo "$PRIVATE_KEY" > private_key
        chmod 600 private_key

        # Create deployment script
        cat > deploy.sh << 'EOF'
        #!/bin/bash
        set -e  # Exit on error

        # Variables
        DEPLOY_FILE=$1
        APP_DIR=/home/ubuntu/app
        BACKUP_DIR=/home/ubuntu/backups

        # Create backup of current deployment
        if [ -d "$APP_DIR" ]; then
          echo "Creating backup..."
          sudo mkdir -p $BACKUP_DIR
          sudo tar -czf $BACKUP_DIR/backup-$(date +%Y%m%d%H%M%S).tar.gz -C $APP_DIR .

          # Keep only last 5 backups
          sudo find $BACKUP_DIR -name "backup-*.tar.gz" -type f | sort -r | tail -n +6 | sudo xargs -r rm
        fi

        # Download new version from S3
        echo "Downloading new version..."
        aws s3 cp s3://your-deployment-bucket/releases/$DEPLOY_FILE /tmp/

        # Extract new version
        echo "Extracting application..."
        sudo mkdir -p $APP_DIR
        sudo rm -rf $APP_DIR/*
        sudo tar -xzf /tmp/$DEPLOY_FILE -C $APP_DIR

        # Install dependencies and build
        cd $APP_DIR
        sudo npm ci --only=production

        # Run database migrations
        echo "Running migrations..."
        NODE_ENV=production npm run migrate

        # Restart application using PM2
        echo "Restarting application..."
        pm2 restart ecosystem.config.js --update-env

        # Health check
        echo "Performing health check..."
        sleep 10

        # Try health check with retries
        for i in {1..5}; do
          if curl -f http://localhost:3000/health; then
            echo "Health check passed!"
            break
          else
            echo "Health check attempt $i failed, retrying..."
            sleep 5
          fi

          if [ $i -eq 5 ]; then
            echo "Health check failed after 5 attempts"
            exit 1
          fi
        done

        echo "Deployment successful!"
        EOF

        # Execute deployment
        ssh -o StrictHostKeyChecking=no -i private_key \
          $@$ \
          'bash -s' < deploy.sh $

        # Cleanup
        rm -f private_key deploy.sh

    # Notify team of deployment
    - name: Send deployment notification
      if: always()  # Run even if deployment fails
      run: |
        if [ "$" == "success" ]; then
          MESSAGE="✅ Deployment successful to production"
          COMMIT_MSG=$(git log -1 --pretty=format:"%s")
          AUTHOR=$(git log -1 --pretty=format:"%an")
        else
          MESSAGE="❌ Deployment failed to production"
          COMMIT_MSG="Failed deployment"
          AUTHOR="GitHub Actions"
        fi

        echo "Status: $MESSAGE"
        echo "Commit: $COMMIT_MSG"
        echo "Author: $AUTHOR"

        # You can integrate with Slack, Discord, Microsoft Teams, etc.
        # Example Slack webhook:
        # curl -X POST -H 'Content-type: application/json' \
        #   --data "{\"text\":\"$MESSAGE\\nCommit: $COMMIT_MSG\\nAuthor: $AUTHOR\"}" \
        #   $
Understanding the Deployment Strategy
Why This Approach? This deployment workflow implements several industry best practices:
- Blue-Green Deployment Preparation: By backing up the current version, we can quickly rollback if needed
- Health Checks: Ensures the application is actually running after deployment
- Atomic Deployments: The entire deployment either succeeds or fails as a unit
- Zero-Downtime: PM2 gracefully reloads the application without dropping connections
The Benefits:
- Reliability: Multiple safety checks prevent broken deployments
- Speed: Automated process completes in 2-3 minutes vs. 30 minutes manually
- Auditability: Every deployment is tracked with timestamps and commit hashes
- Rollback Capability: Quick recovery if issues arise
Deployment Patterns: For more deployment strategies, see Deployment Patterns by Martin Fowler and the AWS Deployment Best Practices guide.
Chapter 4: Advanced Patterns and Best Practices
Let’s explore some advanced patterns that make your CI/CD pipeline more robust and maintainable. Why advanced patterns? As your application grows, simple workflows become insufficient. These patterns address real-world complexity.
Environment-Specific Deployments
The Multi-Environment Challenge: In reality, you’ll have multiple environments (development, staging, production). Each environment serves a different purpose:
- Development: Rapid iteration, experimental features
- Staging: Production-like testing, user acceptance testing
- Production: Live user traffic, maximum stability
Why Multiple Environments? As described in The DevOps Handbook, environments provide:
- Risk Reduction: Test changes before they reach users
- Parallel Development: Multiple features can be tested simultaneously
- Customer Validation: Stakeholders can review features before release
Here’s how to handle this:
name: Deploy to Multiple Environments

on:
  push:
    branches:
      - main        # Production deployment
      - develop     # Staging deployment
      - 'release/*' # Release candidate testing

jobs:
  determine-environment:
    runs-on: ubuntu-latest
    outputs:
      environment: $
    steps:
    - name: Determine deployment environment
      id: determine
      run: |
        # Why this logic? Different branches represent different stages of code maturity
        if [[ "$" == "refs/heads/main" ]]; then
          echo "environment=production" >> $GITHUB_OUTPUT
        elif [[ "$" == "refs/heads/develop" ]]; then
          echo "environment=staging" >> $GITHUB_OUTPUT
        else
          echo "environment=development" >> $GITHUB_OUTPUT
        fi

  deploy:
    needs: determine-environment
    runs-on: ubuntu-latest
    # Why environment gates? GitHub provides manual approval and protection rules
    environment: $
    steps:
    - uses: actions/checkout@v3

    # Environment-specific secrets are automatically available
    # Why automatic? GitHub manages secret scoping by environment
    - name: Deploy to $
      run: |
        echo "Deploying to $"
        echo "Using server: $"
        echo "Using database: $"
        # Your deployment logic here
GitHub Environment Protection Rules: You can configure environments in GitHub to require:
- Manual Approval: For production deployments
- Branch Protection: Only deploy from specific branches
- Time Windows: Deploy only during business hours
- Required Reviewers: Specific team members must approve
Implementing Rollback Capability
Why Rollbacks Matter: According to Google’s SRE practices, the ability to quickly rollback is more important than preventing all failures. When things go wrong, speed of recovery matters more than prevention.
Rollback vs. Forward Fix: While forward fixes are often preferred, rollbacks provide:
- Speed: Immediate relief from production issues
- Simplicity: Known good state vs. uncertain fix
- User Experience: Faster restoration of service
One of the most critical features of a production deployment system is the ability to quickly rollback when things go wrong. Here’s a rollback workflow:
name: Rollback Deployment

# Why workflow_dispatch? Manual trigger for emergency situations
on:
  workflow_dispatch:
    inputs:
      version:
        description: 'Version to rollback to (e.g., 20231125120000)'
        required: true
        type: string
      environment:
        description: 'Environment to rollback'
        required: true
        type: choice
        options:
          - production
          - staging

jobs:
  rollback:
    runs-on: ubuntu-latest
    environment: $
    steps:
    - name: Validate version exists
      run: |
        # Check if version exists in S3
        aws s3 ls s3://your-deployment-bucket/releases/deploy-$.tar.gz || {
          echo "❌ Version $ not found!"
          exit 1
        }

    - name: Rollback to version $
      env:
        PRIVATE_KEY: $
      run: |
        # Save private key
        echo "$PRIVATE_KEY" > private_key
        chmod 600 private_key

        # Create rollback script
        cat > rollback.sh << 'EOF'
        #!/bin/bash
        set -e

        VERSION=$1
        APP_DIR=/home/ubuntu/app
        FAILED_DIR=/home/ubuntu/failed-deployments

        # Why capture failed deployment? Helps with post-incident analysis
        echo "Capturing failed deployment for analysis..."
        sudo mkdir -p $FAILED_DIR
        sudo tar -czf $FAILED_DIR/failed-$(date +%Y%m%d%H%M%S).tar.gz -C $APP_DIR .

        # Download specified version
        echo "Downloading version $VERSION..."
        aws s3 cp s3://your-deployment-bucket/releases/deploy-$VERSION.tar.gz /tmp/

        # Extract rollback version
        echo "Extracting rollback version..."
        sudo rm -rf $APP_DIR/*
        sudo tar -xzf /tmp/deploy-$VERSION.tar.gz -C $APP_DIR

        # Restore application
        cd $APP_DIR
        sudo npm ci --only=production

        # Check if database rollback is needed
        # Why manual check? Database rollbacks are riskier and need careful consideration
        echo "⚠️  WARNING: This rollback may require database changes"
        echo "Please verify database compatibility manually if needed"

        # Restart application
        pm2 restart ecosystem.config.js --update-env

        # Health check with longer timeout for rollbacks
        echo "Performing health check..."
        sleep 10

        for i in {1..10}; do
          if curl -f http://localhost:3000/health; then
            echo "✅ Rollback health check passed!"
            break
          else
            echo "⏳ Health check attempt $i failed, retrying..."
            sleep 5
          fi

          if [ $i -eq 10 ]; then
            echo "❌ Rollback health check failed after 10 attempts"
            echo "Manual intervention required!"
            exit 1
          fi
        done

        echo "🎉 Rollback to version $VERSION successful!"
        EOF

        # Execute rollback
        ssh -o StrictHostKeyChecking=no -i private_key \
          $@$ \
          'bash -s' < rollback.sh $

        # Cleanup
        rm -f private_key rollback.sh

    # Post-rollback notification
    - name: Notify team of rollback
      run: |
        MESSAGE="🔄 Rollback completed to version $ on $"
        echo "$MESSAGE"

        # Post to incident management system
        # Example: PagerDuty, Opsgenie, or internal systems
Rollback Best Practices:
- Test Rollbacks: Regularly test the rollback process in staging
- Document Limitations: Some changes (database schema) can’t be rolled back
- Time Limits: Set SLAs for rollback execution (e.g., 5 minutes)
- Communication: Keep stakeholders informed during rollbacks
Implementing Database Migration Safety
The Database Challenge: Database migrations are often the trickiest part of deployments. Unlike application code, database changes can be difficult or impossible to rollback. Why are databases special?
- State: Databases contain data that can’t be easily recreated
- Compatibility: Schema changes must work with both old and new code
- Performance: Large migrations can cause downtime
- Rollback Complexity: Data migrations are often irreversible
Migration Strategies: As Martin Fowler explains in Evolutionary Database Design, successful database evolution requires careful planning and backwards-compatible changes.
Here’s a pattern for safe migrations:
// migrations/runner.js
const { Client } = require('pg');
const fs = require('fs').promises;
const path = require('path');

class MigrationRunner {
  constructor(databaseUrl) {
    this.client = new Client({ connectionString: databaseUrl });
    this.migrationsDir = path.join(__dirname, 'sql');
  }

  async run() {
    await this.client.connect();

    try {
      // Create migrations table if not exists
      await this.ensureMigrationsTable();

      // Get pending migrations
      const pending = await this.getPendingMigrations();

      if (pending.length === 0) {
        console.log('✅ No pending migrations');
        return;
      }

      console.log(`📦 Found ${pending.length} pending migrations`);

      // Run migrations in transaction
      await this.client.query('BEGIN');

      for (const migration of pending) {
        console.log(`🔄 Running migration: ${migration}`);

        const startTime = Date.now();

        // Read migration file
        const sql = await fs.readFile(
          path.join(this.migrationsDir, migration),
          'utf8'
        );

        // Validate migration before executing
        await this.validateMigration(sql);

        // Execute migration
        await this.client.query(sql);

        const duration = Date.now() - startTime;

        // Record migration
        await this.client.query(
          'INSERT INTO schema_migrations (version, duration_ms) VALUES ($1, $2)',
          [migration, duration]
        );

        console.log(`✅ Migration ${migration} completed in ${duration}ms`);
      }

      await this.client.query('COMMIT');
      console.log('🎉 All migrations completed successfully');

    } catch (error) {
      await this.client.query('ROLLBACK');
      console.error('❌ Migration failed:', error.message);
      throw error;
    } finally {
      await this.client.end();
    }
  }

  async ensureMigrationsTable() {
    await this.client.query(`
      CREATE TABLE IF NOT EXISTS schema_migrations (
        version VARCHAR(255) PRIMARY KEY,
        executed_at TIMESTAMP DEFAULT CURRENT_TIMESTAMP,
        duration_ms INTEGER
      )
    `);
  }

  async validateMigration(sql) {
    // Basic validation rules
    const lowerSql = sql.toLowerCase();

    // Check for dangerous operations
    if (lowerSql.includes('drop table') && !lowerSql.includes('if exists')) {
      throw new Error('DROP TABLE without IF EXISTS is not allowed');
    }

    if (lowerSql.includes('truncate')) {
      throw new Error('TRUNCATE operations are not allowed in migrations');
    }

    // Check for missing semicolons (common error)
    const statements = sql.split(';').filter(s => s.trim());
    if (statements.length > 1 && !sql.trim().endsWith(';')) {
      console.warn('⚠️  Warning: Migration may be missing final semicolon');
    }
  }

  async getPendingMigrations() {
    // Get all migration files
    const files = await fs.readdir(this.migrationsDir);
    const migrations = files
      .filter(f => f.endsWith('.sql'))
      .sort(); // Important: migrations run in order

    // Get executed migrations
    const result = await this.client.query(
      'SELECT version FROM schema_migrations ORDER BY executed_at'
    );
    const executed = new Set(result.rows.map(r => r.version));

    // Return pending migrations
    return migrations.filter(m => !executed.has(m));
  }

  // Migration rollback support (limited)
  async rollback(steps = 1) {
    // Why limited rollback? Most database operations can't be safely reversed
    console.warn('⚠️  Database rollbacks are dangerous and limited');
    console.warn('This will only work for specific types of migrations');

    // Implementation would depend on your specific needs
    // Generally, database rollbacks require pre-planned rollback scripts
  }
}

// Usage in deployment
if (require.main === module) {
  const runner = new MigrationRunner(process.env.DATABASE_URL);

  runner.run().catch(error => {
    console.error('💥 Migration failed:', error);
    process.exit(1);
  });
}

module.exports = MigrationRunner;
Safe Migration Practices:
- Backwards Compatibility: New migrations should work with the previous version of your app
- Small Steps: Break large changes into multiple small migrations
- Test First: Always test migrations on a copy of production data
- Monitoring: Watch database performance during and after migrations
- Rollback Scripts: For complex changes, prepare rollback procedures
Monitoring and Alerting
Why Monitoring Matters: A deployment isn’t complete without proper monitoring. As the Google SRE Book states, “Monitoring is one of the primary means by which service owners keep track of a system’s health and availability.”
The Four Golden Signals (from Google SRE):
- Latency: How fast are requests being processed?
- Traffic: How much demand is being placed on your system?
- Errors: What is the rate of requests that fail?
- Saturation: How full is your service?
Here’s how to add basic monitoring to your workflow:
- name: Post-deployment monitoring
  run: |
    # Function to check endpoint
    check_endpoint() {
      local url=$1
      local expected_status=$2
      local max_attempts=10
      local attempt=0

      echo "🔍 Checking $url (expecting $expected_status)"

      while [ $attempt -lt $max_attempts ]; do
        # Why curl flags? -s (silent), -o /dev/null (ignore body), -w (write out format)
        response=$(curl -s -o /dev/null -w "%{http_code},%{time_total},%{size_download}" $url)
        status=$(echo $response | cut -d',' -f1)
        time_total=$(echo $response | cut -d',' -f2)
        size=$(echo $response | cut -d',' -f3)

        if [ "$status" = "$expected_status" ]; then
          echo "✅ $url returned $status in ${time_total}s (${size} bytes)"
          return 0
        fi

        echo "⏳ $url returned $status (expected $expected_status), attempt $((attempt + 1))/$max_attempts"
        attempt=$((attempt + 1))
        sleep 5
      done

      echo "❌ $url failed after $max_attempts attempts"
      return 1
    }

    echo "🩺 Starting post-deployment health checks..."

    # Check critical endpoints
    check_endpoint "https://api.example.com/health" "200"
    check_endpoint "https://api.example.com/api/v1/status" "200"
    check_endpoint "https://api.example.com/api/v1/users/me" "401"  # Should require auth

    echo "⏱️  Measuring performance..."

    # Check response times
    response_time=$(curl -s -o /dev/null -w "%{time_total}" https://api.example.com/health)
    echo "Health check response time: ${response_time}s"

    # Alert if response time is too high
    if (( $(echo "$response_time > 2.0" | bc -l) )); then
      echo "⚠️  WARNING: High response time detected! (${response_time}s > 2.0s)"

      # Send alert to monitoring system
      # Example: Post to Slack, PagerDuty, or custom monitoring
      curl -X POST -H 'Content-type: application/json' \
        --data "{\"text\":\"🚨 High response time after deployment: ${response_time}s\"}" \
        $ || echo "Failed to send alert"
    fi

    # Check database connection
    echo "🗄️  Checking database connectivity..."
    ssh -o StrictHostKeyChecking=no -i private_key \
      $@$ \
      'cd /home/ubuntu/app && npm run db:check' || {
      echo "❌ Database connectivity check failed"
      exit 1
    }

    # Check memory usage
    echo "💾 Checking system resources..."
    memory_usage=$(ssh -o StrictHostKeyChecking=no -i private_key \
      $@$ \
      "free | grep Mem | awk '{printf \"%.0f\", \$3/\$2 * 100.0}'")

    echo "Memory usage: ${memory_usage}%"

    if [ "$memory_usage" -gt 85 ]; then
      echo "⚠️  WARNING: High memory usage detected! (${memory_usage}% > 85%)"
    fi

    echo "✅ Post-deployment monitoring completed"
Chapter 5: Security Best Practices
Security should be woven throughout your CI/CD pipeline, not added as an afterthought. Why security-first? According to the 2021 Software Supply Chain Security Report, supply chain attacks increased by 650% in 2021. CI/CD pipelines are prime targets.
The Security Mindset: Think of your pipeline as a critical piece of infrastructure that attackers might target. Every step should be secured.
Dependency Scanning
Why Scan Dependencies? Open source packages often contain vulnerabilities. The Equifax breach was caused by a known vulnerability in Apache Struts that hadn’t been patched.
Add automated dependency scanning to catch vulnerabilities:
- name: Run security audit
  run: |
    echo "🔍 Scanning for known vulnerabilities..."

    # Check for known vulnerabilities - Why npm audit? Built into npm, checks against npm security database
    npm audit --production

    # For more strict checking (fails on any vulnerability)
    # Uncomment the line below for zero-tolerance security policy
    # npm audit --production --audit-level=low

    # Generate detailed audit report
    npm audit --json > audit-report.json || true

    # Parse and display critical vulnerabilities
    if command -v jq &> /dev/null; then
      echo "🚨 Critical vulnerabilities found:"
      jq '.vulnerabilities | to_entries[] | select(.value.severity == "critical") | {package: .key, severity: .value.severity, title: .value.title}' audit-report.json
    fi

- name: Run Snyk security scan
  uses: snyk/actions/node@master
  env:
    SNYK_TOKEN: $
  with:
    # Why severity threshold? Focus on actionable vulnerabilities
    args: --severity-threshold=high
    # Generate reports for security team review
    json: true
    sarif: true

- name: Upload Snyk results to GitHub Security tab
  uses: github/codeql-action/upload-sarif@v2
  if: always()
  with:
    sarif_file: snyk.sarif
Why Multiple Tools? Different scanners catch different vulnerabilities:
- npm audit: Fast, built-in, good for basic scanning
- Snyk: More comprehensive, better reporting, includes remediation advice
- GitHub Security: Integrates with pull requests and security tab
Secrets Scanning
Why Scan for Secrets? Accidentally committed secrets are a major security risk. GitHub’s Secret Scanning study found thousands of secrets committed daily.
Prevent accidental commits of secrets:
- name: Scan for secrets
  uses: trufflesecurity/trufflehog@main
  with:
    path: ./
    base: $
    head: HEAD
    # Why these options? Balance between thoroughness and false positives
    extra_args: --debug --only-verified

- name: GitLeaks secret scan
  uses: gitleaks/gitleaks-action@v2
  env:
    GITHUB_TOKEN: $
  with:
    # Why fail on detection? Prevent secrets from entering the codebase
    fail: true
What Gets Scanned?
- API keys (AWS, GitHub, etc.)
- Database connection strings
- Private keys
- Passwords and tokens
- Configuration files with embedded secrets
Container Scanning (if using Docker)
Why Container Scanning? Base images often contain vulnerabilities. The 2020 State of Container Security Report found that 58% of container images had known vulnerabilities.
If you’re deploying containers, scan them for vulnerabilities:
- name: Build Docker image
  run: |
    # Build with specific tag for tracking
    docker build -t $:$ .
    docker build -t $:latest .

- name: Run Trivy vulnerability scanner
  uses: aquasecurity/trivy-action@master
  with:
    image-ref: '$:$'
    format: 'sarif'
    output: 'trivy-results.sarif'
    # Why these severities? Focus on actionable vulnerabilities
    severity: 'MEDIUM,HIGH,CRITICAL'
    # Why ignore unfixed? Can't do anything about them anyway
    ignore-unfixed: true

- name: Upload Trivy scan results
  uses: github/codeql-action/upload-sarif@v2
  if: always()
  with:
    sarif_file: 'trivy-results.sarif'

- name: Docker Scout scan
  uses: docker/scout-action@v1
  with:
    command: cves
    image: $:$
    # Why exit on vulnerabilities? Prevent vulnerable images from being deployed
    exit-code: true
    only-severities: critical,high
SAST (Static Application Security Testing)
Why SAST? Static analysis catches security issues in your code before they reach production. Tools like CodeQL can find SQL injection, XSS, and other common vulnerabilities.
- name: Initialize CodeQL
  uses: github/codeql-action/init@v2
  with:
    languages: javascript
    # Why specify queries? Focus on security-related issues
    queries: security-extended

- name: Perform CodeQL Analysis
  uses: github/codeql-action/analyze@v2
  with:
    category: "/language:javascript"
Chapter 6: Debugging Common Issues
Even with the best planning, things go wrong. Why focus on debugging? According to research by IBM, developers spend 50% of their time debugging. Efficient debugging saves enormous amounts of time.
Here are common issues and how to debug them systematically.
Debugging Failed Workflows
The Debugging Mindset: Approach debugging systematically. As outlined in The Pragmatic Programmer, debugging is problem-solving, not random clicking.
GitHub Actions provides several tools for debugging:
- name: Debug information
  if: failure()  # Why only on failure? Reduces noise in successful runs
  run: |
    echo "🐛 Debug Information for Failed Workflow"
    echo "======================================"
    echo "Event: $"
    echo "Ref: $"
    echo "SHA: $"
    echo "Actor: $"
    echo "Workflow: $"
    echo "Job: $"
    echo "Run ID: $"
    echo "Run Number: $"

    # Show environment variables (be careful with secrets!)
    echo ""
    echo "🌍 Environment Variables (filtered):"
    env | grep -v SECRET | grep -v TOKEN | grep -v KEY | sort

    # Show runner information
    echo ""
    echo "🖥️  Runner Information:"
    echo "Runner OS: $"
    echo "Runner Arch: $"
    echo "Runner Temp: $"
    echo "Runner Tool Cache: $"

    # Show disk space (common issue)
    echo ""
    echo "💾 Disk Usage:"
    df -h

    # Show system resources
    echo ""
    echo "⚡ System Resources:"
    free -h

- name: Setup tmate session for debugging
  # Why only on manual trigger? Prevents accidental exposure of debugging sessions
  if: $
  uses: mxschmitt/action-tmate@v3
  with:
    # Why limit access? Security - only the workflow triggerer can access
    limit-access-to-actor: true
    # Why timeout? Prevents sessions from running indefinitely
    timeout-minutes: 30

- name: Upload logs on failure
  if: failure()
  uses: actions/upload-artifact@v3
  with:
    name: debug-logs-$
    path: |
      /tmp/debug.log
      ~/.npm/_logs/
      $
    retention-days: 7
Debugging Strategies:
- Read Error Messages Carefully: Often the answer is in the error message
- Check Dependencies: Version conflicts are common causes of failures
- Verify Secrets: Incorrect or missing secrets cause many deployment failures
- Test Locally: Reproduce the issue in your local environment
Common EC2 Connection Issues
Why SSH Fails: SSH connections can fail for many reasons - security groups, key permissions, network issues, or server problems. Systematic debugging saves time.
When SSH connections fail, here’s a systematic debugging approach:
- name: Debug SSH connection
  if: failure()
  run: |
    echo "🔧 Debugging SSH Connection Issues"
    echo "================================"

    # Test basic connectivity
    echo "🌐 Testing network connectivity..."
    ping -c 4 $ || echo "❌ Ping failed - check security groups and network"

    # Test SSH port
    echo ""
    echo "🔌 Testing SSH port 22..."
    timeout 10 nc -zv $ 22 || echo "❌ Port 22 not accessible - check security groups"

    # Check if host key has changed
    echo ""
    echo "🔑 Testing SSH host key..."
    ssh-keyscan -H $ 2>/dev/null || echo "❌ SSH host key scan failed"

    # Verbose SSH attempt (remove sensitive key content from logs)
    echo ""
    echo "🐛 Verbose SSH connection test..."
    echo "$" > private_key
    chmod 600 private_key

    # Why timeout? Prevents hanging on failed connections
    timeout 30 ssh -vvv -o StrictHostKeyChecking=no -o ConnectTimeout=10 -i private_key \
      $@$ \
      'echo "✅ SSH connection successful"' 2>&1 | head -50 || {
      echo "❌ SSH connection failed"
      echo ""
      echo "Common solutions:"
      echo "1. Check EC2 security group allows SSH (port 22) from GitHub Actions IPs"
      echo "2. Verify EC2 instance is running and accessible"
      echo "3. Check SSH key format and permissions"
      echo "4. Ensure EC2_USER is correct (ubuntu for Ubuntu, ec2-user for Amazon Linux)"
    }

    rm -f private_key

    # Check GitHub Actions IP ranges
    echo ""
    echo "📡 GitHub Actions IP ranges (for security group configuration):"
    curl -s https://api.github.com/meta | jq -r '.actions[]' 2>/dev/null || echo "Failed to fetch GitHub IPs"

- name: Test EC2 instance status
  if: failure()
  run: |
    echo "🖥️  Checking EC2 instance status..."

    # This requires EC2 permissions in your IAM policy
    aws ec2 describe-instances \
      --filters "Name=ip-address,Values=$" \
      --query 'Reservations[*].Instances[*].[InstanceId,State.Name,PublicIpAddress]' \
      --output table || echo "Failed to get EC2 status (check AWS permissions)"
Common SSH Issues and Solutions:
- Security Groups: Must allow SSH (port 22) from GitHub Actions IP ranges
- Key Format: Ensure SSH key is in correct format (starts with
-----BEGIN) - Instance State: EC2 instance must be running
- User Names: Ubuntu uses
ubuntu, Amazon Linux usesec2-user
Performance Optimization
Why Performance Matters: Slow CI/CD pipelines reduce developer productivity. According to DORA Research, high-performing teams have significantly faster build times.
As your pipeline grows, performance becomes crucial. Here are optimization strategies:
# Parallel job execution - Why? Reduce total pipeline time
jobs:
  tests:
    strategy:
      # Why matrix? Run different test suites in parallel
      matrix:
        test-suite: [unit, integration, e2e]
        node-version: [16, 18, 20]
    runs-on: ubuntu-latest
    steps:
    - uses: actions/checkout@v3
    - name: Setup Node.js $
      uses: actions/setup-node@v3
      with:
        node-version: $
    - name: Run $ tests
      run: npm run test:$

  # Jobs run in parallel by default - Why? Maximize resource utilization
  lint:
    runs-on: ubuntu-latest
    steps:
    - uses: actions/checkout@v3
    - name: Run linting
      run: npm run lint

  security-scan:
    runs-on: ubuntu-latest
    steps:
    - uses: actions/checkout@v3
    - name: Run security scan
      run: npm audit

  # Conditional jobs - Why? Skip unnecessary work
  deploy:
    needs: [tests, lint, security-scan]
    # Only run on main branch pushes
    if: github.ref == 'refs/heads/main' && github.event_name == 'push'
    runs-on: ubuntu-latest
    steps:
    - name: Deploy
      run: echo "Deploying..."
Caching Strategies
Why Caching Matters: Effective caching can reduce build times from 5 minutes to 1 minute. Over hundreds of builds per month, this saves hours of waiting time.
Effective caching can significantly speed up your workflows:
# Advanced caching strategy
- name: Cache multiple dependencies
  uses: actions/cache@v3
  with:
    path: |
      ~/.npm
      ~/.cache
      node_modules
      # Why cache node_modules? npm ci can be slow even with cache
    # Why complex key? Ensures cache invalidation when any dependency changes
    key: $-node-$-$
    restore-keys: |
      $-node-$-
      $-node-

# Docker layer caching - Why? Docker builds can be very slow
- name: Set up Docker Buildx
  uses: docker/setup-buildx-action@v2

- name: Build and cache Docker image
  uses: docker/build-push-action@v4
  with:
    context: .
    push: false
    tags: myapp:latest
    # Why GitHub Actions cache? Free and automatic
    cache-from: type=gha
    cache-to: type=gha,mode=max

# Database caching for tests
- name: Cache test database
  uses: actions/cache@v3
  with:
    path: /tmp/test-db
    key: test-db-$

# Warm up cache in separate job
warm-cache:
  runs-on: ubuntu-latest
  steps:
  - uses: actions/checkout@v3
  - name: Warm dependency cache
    uses: actions/cache@v3
    with:
      path: ~/.npm
      key: $-node-$
  - run: npm ci
Caching Best Practices:
- Cache Keys: Use file hashes to ensure cache invalidation when dependencies change
- Cache Hierarchy: Use restore-keys for graceful degradation
- Size Limits: GitHub Actions has a 10GB cache limit per repository
- TTL: Caches are automatically deleted after 7 days of no access
Chapter 7: Monitoring and Observability
Once your CI/CD pipeline is running, you need visibility into its performance and reliability. Why observability? You can’t improve what you can’t measure. The Google SRE Book emphasizes that monitoring is essential for understanding system behavior.
The Three Pillars of Observability:
- Metrics: Quantitative measurements over time
- Logs: Discrete events that happened
- Traces: The path of a request through your system
GitHub Actions Metrics
Why Track Pipeline Metrics? Understanding your pipeline performance helps identify bottlenecks and improvement opportunities. Common metrics include:
- Build Duration: How long does the pipeline take?
- Success Rate: What percentage of builds succeed?
- Queue Time: How long do builds wait to start?
- Frequency: How often are builds triggered?
Create a workflow to track pipeline metrics:
name: Pipeline Metrics

# Why workflow_run trigger? Captures data after each pipeline execution
on:
  workflow_run:
    workflows: ["Deploy to AWS", "Continuous Integration"]
    types: [completed]

jobs:
  collect-metrics:
    runs-on: ubuntu-latest
    steps:
    - name: Calculate and store metrics
      uses: actions/github-script@v6
      with:
        github-token: $
        script: |
          const workflow_run = context.payload.workflow_run;

          // Calculate duration - Why important? Track performance trends
          const started = new Date(workflow_run.created_at);
          const completed = new Date(workflow_run.updated_at);
          const duration = (completed - started) / 1000 / 60; // minutes

          // Extract useful information
          const metrics = {
            workflow_name: workflow_run.name,
            status: workflow_run.conclusion,
            duration_minutes: Math.round(duration * 100) / 100,
            branch: workflow_run.head_branch,
            commit_sha: workflow_run.head_sha.substring(0, 7),
            author: workflow_run.triggering_actor.login,
            timestamp: completed.toISOString(),
            attempt: workflow_run.run_attempt,
            event: workflow_run.event
          };

          console.log('📊 Pipeline Metrics:');
          console.log(`Workflow: ${metrics.workflow_name}`);
          console.log(`Status: ${metrics.status}`);
          console.log(`Duration: ${metrics.duration_minutes} minutes`);
          console.log(`Branch: ${metrics.branch}`);
          console.log(`Author: ${metrics.author}`);
          console.log(`Attempt: ${metrics.attempt}`);

          // Store in repository (simple approach)
          try {
            const metricsFile = `metrics/${new Date().toISOString().split('T')[0]}.json`;

            // Try to get existing metrics for today
            let existingMetrics = [];
            try {
              const { data: fileData } = await github.rest.repos.getContent({
                owner: context.repo.owner,
                repo: context.repo.repo,
                path: metricsFile
              });
              existingMetrics = JSON.parse(Buffer.from(fileData.content, 'base64').toString());
            } catch (error) {
              // File doesn't exist yet, that's okay
            }

            // Add new metrics
            existingMetrics.push(metrics);

            // Store updated metrics
            const content = Buffer.from(JSON.stringify(existingMetrics, null, 2)).toString('base64');

            await github.rest.repos.createOrUpdateFileContents({
              owner: context.repo.owner,
              repo: context.repo.repo,
              path: metricsFile,
              message: `Update pipeline metrics for ${metrics.workflow_name}`,
              content: content,
              sha: fileData?.sha // Include SHA if file exists
            });

          } catch (error) {
            console.log('Failed to store metrics:', error.message);
          }

          // Alert on failures or slow builds
          if (metrics.status === 'failure') {
            console.log('🚨 Build failed! Consider alerting the team.');
          }

          if (metrics.duration_minutes > 10) {
            console.log(`⚠️ Slow build detected: ${metrics.duration_minutes} minutes`);
          }
Creating a Deployment Dashboard
Why a Dashboard? Visual dashboards provide quick insights into deployment health and trends. They help teams understand deployment patterns and identify issues quickly.
Consider creating a simple deployment dashboard:
// deployment-dashboard.js
const express = require('express');
const { Octokit } = require('@octokit/rest');
const path = require('path');

const app = express();
const port = process.env.PORT || 3001;

// Why Octokit? Official GitHub API client with good error handling
const octokit = new Octokit({
  auth: process.env.GITHUB_TOKEN
});

// Serve static files for dashboard UI
app.use(express.static('public'));

// API endpoint for deployment data
app.get('/api/deployments', async (req, res) => {
  try {
    console.log('📊 Fetching deployment data...');

    // Get recent workflow runs
    const { data: workflows } = await octokit.actions.listWorkflowRunsForRepo({
      owner: process.env.GITHUB_OWNER || 'your-org',
      repo: process.env.GITHUB_REPO || 'your-repo',
      workflow_id: 'deploy.yml',
      per_page: 50 // Why 50? Balance between completeness and performance
    });

    // Transform data for dashboard
    const deployments = workflows.workflow_runs.map(run => ({
      id: run.id,
      status: run.conclusion,
      branch: run.head_branch,
      commit: run.head_sha.substring(0, 7),
      message: run.head_commit?.message?.split('\n')[0] || 'No message',
      author: run.triggering_actor.login,
      started: run.created_at,
      completed: run.updated_at,
      duration: calculateDuration(run.created_at, run.updated_at),
      url: run.html_url,
      attempt: run.run_attempt
    }));

    // Calculate statistics
    const stats = calculateStats(deployments);

    res.json({
      deployments,
      stats,
      lastUpdated: new Date().toISOString()
    });

  } catch (error) {
    console.error('❌ Error fetching deployments:', error);
    res.status(500).json({
      error: 'Failed to fetch deployments',
      message: error.message
    });
  }
});

// Calculate deployment statistics
function calculateStats(deployments) {
  const total = deployments.length;
  const successful = deployments.filter(d => d.status === 'success').length;
  const failed = deployments.filter(d => d.status === 'failure').length;
  const successRate = total > 0 ? ((successful / total) * 100).toFixed(1) : 0;

  // Calculate average duration
  const durations = deployments
    .filter(d => d.status === 'success')
    .map(d => parseDuration(d.duration));
  const avgDuration = durations.length > 0
    ? durations.reduce((a, b) => a + b, 0) / durations.length
    : 0;

  return {
    total,
    successful,
    failed,
    successRate: parseFloat(successRate),
    averageDuration: formatDuration(avgDuration)
  };
}

function calculateDuration(start, end) {
  const duration = new Date(end) - new Date(start);
  const minutes = Math.floor(duration / 60000);
  const seconds = Math.floor((duration % 60000) / 1000);
  return `${minutes}m ${seconds}s`;
}

function parseDuration(durationStr) {
  // Convert "5m 30s" to seconds
  const matches = durationStr.match(/(\d+)m\s*(\d+)s/);
  if (matches) {
    return parseInt(matches[1]) * 60 + parseInt(matches[2]);
  }
  return 0;
}

function formatDuration(seconds) {
  const minutes = Math.floor(seconds / 60);
  const remainingSeconds = Math.floor(seconds % 60);
  return `${minutes}m ${remainingSeconds}s`;
}

// Health check endpoint
app.get('/health', (req, res) => {
  res.json({
    status: 'healthy',
    service: 'deployment-dashboard',
    timestamp: new Date().toISOString()
  });
});

// Error handling middleware
app.use((error, req, res, next) => {
  console.error('💥 Unhandled error:', error);
  res.status(500).json({
    error: 'Internal server error',
    message: process.env.NODE_ENV === 'development' ? error.message : 'Something went wrong'
  });
});

app.listen(port, () => {
  console.log(`📊 Deployment dashboard running on port ${port}`);
  console.log(`Visit http://localhost:${port} to view the dashboard`);
});
Dashboard Features to Consider:
- Deployment Timeline: Visual timeline of recent deployments
- Success Rate Trends: Track improvement over time
- Performance Metrics: Build duration trends
- Failure Analysis: Common failure patterns and causes
- Team Metrics: Individual and team deployment patterns
Integration with External Monitoring
Why External Monitoring? While GitHub provides basic metrics, external tools offer advanced analytics, alerting, and correlation with application metrics.
Popular Monitoring Integrations:
- DataDog: Comprehensive monitoring with GitHub Actions integration
- New Relic: Application performance monitoring with deployment markers
- CloudWatch: AWS native monitoring for infrastructure and applications
- Prometheus/Grafana: Open source monitoring stack
Example integration with CloudWatch:
- name: Send metrics to CloudWatch
  run: |
    # Send deployment event to CloudWatch
    aws cloudwatch put-metric-data \
      --namespace "GitHubActions/Deployments" \
      --metric-data \
        MetricName=DeploymentDuration,Value=$,Unit=Seconds \
        MetricName=DeploymentSuccess,Value=1,Unit=Count

    # Create deployment marker in CloudWatch Insights
    aws logs put-log-events \
      --log-group-name "/aws/lambda/deployment-events" \
      --log-stream-name "deployments" \
      --log-events \
        timestamp=$(date +%s)000,message='{"event":"deployment","status":"success","commit":"$","duration":$}'
Best Practices Summary
As we wrap up this journey, let’s consolidate the key best practices we’ve learned. Why summarize? Research shows that summarizing key points improves retention and application of knowledge.
1. Start Simple, Iterate Often
Don’t try to build the perfect pipeline from day one. Why start simple? As the Lean Startup methodology teaches, it’s better to get something working quickly and improve it based on real experience.
Implementation Strategy:
- Week 1: Basic CI with tests
- Week 2: Add deployment to staging
- Week 3: Add production deployment with manual approval
- Week 4: Add monitoring and alerts
- Month 2: Add advanced security scanning
- Month 3: Add performance optimization
2. Fail Fast, Fail Clearly
Design your pipeline to catch issues as early as possible. Why fail fast? The cost of fixing issues increases exponentially as they move through the pipeline. A linting error caught in CI costs seconds to fix; the same issue in production costs hours.
Implementation Tips:
- Run fastest checks first (linting before tests)
- Use clear, actionable error messages
- Include debugging information in failures
- Set up notifications for critical failures
3. Security is Not Optional
Treat secrets with respect, scan for vulnerabilities, and follow the principle of least privilege. Why security first? A compromised CI/CD pipeline can be more dangerous than a compromised application—it’s the key to your entire infrastructure.
Security Checklist:
- ✅ All secrets stored in GitHub Secrets
- ✅ Dependency scanning enabled
- ✅ Secret scanning enabled
- ✅ IAM users follow least privilege
- ✅ SSH keys are rotated regularly
- ✅ Pipeline logs don’t contain sensitive data
4. Monitor Everything
You can’t improve what you don’t measure. Why monitor? The DORA State of DevOps Report consistently shows that high-performing teams measure and optimize their development practices.
Key Metrics to Track:
- Deployment Frequency: How often you deploy
- Lead Time: Time from commit to production
- Mean Time to Recovery: How quickly you recover from failures
- Change Failure Rate: Percentage of deployments that cause problems
5. Documentation is Part of the Pipeline
Your pipeline configuration IS documentation, but don’t stop there. Why document? Future you will thank present you. Team members need to understand the pipeline to maintain and improve it.
Documentation Strategy:
- Comment your YAML files extensively
- Maintain a deployment runbook
- Document troubleshooting procedures
- Create architectural decision records (ADRs)
6. Test the Pipeline Itself
Your CI/CD pipeline is critical infrastructure. Why test infrastructure? Just like application code, infrastructure can have bugs. Testing prevents outages and ensures reliability.
Testing Strategies:
- Regular disaster recovery drills
- Test rollback procedures
- Validate deployment in staging first
- Monitor pipeline performance metrics
Conclusion and Next Steps
Congratulations! You’ve built a production-ready CI/CD pipeline that automatically tests and deploys your application. The Impact: This pipeline will save countless hours and reduce deployment anxiety significantly. More importantly, it enables the rapid, reliable delivery that modern software development demands.
What You’ve Accomplished:
- ✅ Automated testing on every code change
- ✅ Secure, reliable deployments to AWS
- ✅ Rollback capabilities for quick recovery
- ✅ Security scanning and vulnerability detection
- ✅ Monitoring and observability
- ✅ Documentation and best practices
But this is just the beginning. Why continue improving? CI/CD is not a destination—it’s a practice that evolves with your team and application needs.
Here are some next steps to consider:
Immediate Improvements (Next 30 Days)
- Explore GitHub Environments: Use GitHub’s environment protection rules for manual approvals and deployment windows
- Add Performance Testing: Integrate load testing into your pipeline to catch performance regressions
- Improve Notifications: Set up Slack or Teams integration for deployment status
Medium-term Goals (Next 3 Months)
- Implement Progressive Deployments: Look into canary deployments or feature flags for safer rollouts
- Add Database Migration Safety: Implement comprehensive migration testing and rollback procedures
- Explore Infrastructure as Code: Consider using Terraform or CloudFormation to manage your AWS resources
Long-term Vision (Next 6-12 Months)
- Investigate Container Orchestration: If your application grows, consider ECS or EKS for container management
- Implement GitOps: Explore tools like ArgoCD for Kubernetes deployments
- Advanced Monitoring: Add distributed tracing and application performance monitoring
Learning Resources
For deeper dives into specific topics:
- GitHub Actions documentation - The official comprehensive guide
- AWS DevOps practices - AWS’s collection of DevOps resources
- The DevOps Handbook - Excellent book on DevOps principles
- Continuous Delivery - Jez Humble’s foundational work on CD practices
- Google SRE Book - Site Reliability Engineering best practices
- DORA Research - Evidence-based DevOps practices
Community and Support
- GitHub Community Forum - Get help with GitHub Actions
- AWS re:Post - AWS community support
- DevOps Subreddit - Active community discussions
- CNCF Slack - Cloud native computing discussions
Final Thoughts
Remember that CI/CD is about more than just tools—it’s about culture, collaboration, and continuous improvement. The real value comes from the confidence it gives your team to ship features quickly and safely.
As you continue your DevOps journey, focus on:
- Measuring and improving your key metrics
- Sharing knowledge with your team
- Automating repetitive tasks wherever possible
- Learning from failures and improving processes
- Staying current with new tools and practices
The pipeline you’ve built today is a foundation for scaling your development practices. With each improvement, you’re not just making deployments faster—you’re enabling your team to deliver more value to users, more reliably, and with greater confidence.
Happy deploying! 🚀
This guide provides a comprehensive introduction to CI/CD with GitHub Actions and AWS. For the latest information and updates, always refer to the official documentation and community resources.